Demo-ATS Quant Volume Scalp 3 (North American Session)
This model was trained over multiple years of market data to learn the underlying distribution of orderflow.
Once this distribution was learned, the model could then make forecasts as to what future liquidity could be.
These forecasts are based on what the model has observed and thus significant deviations in what the model expects and what happens represents the epitome of market generated information.
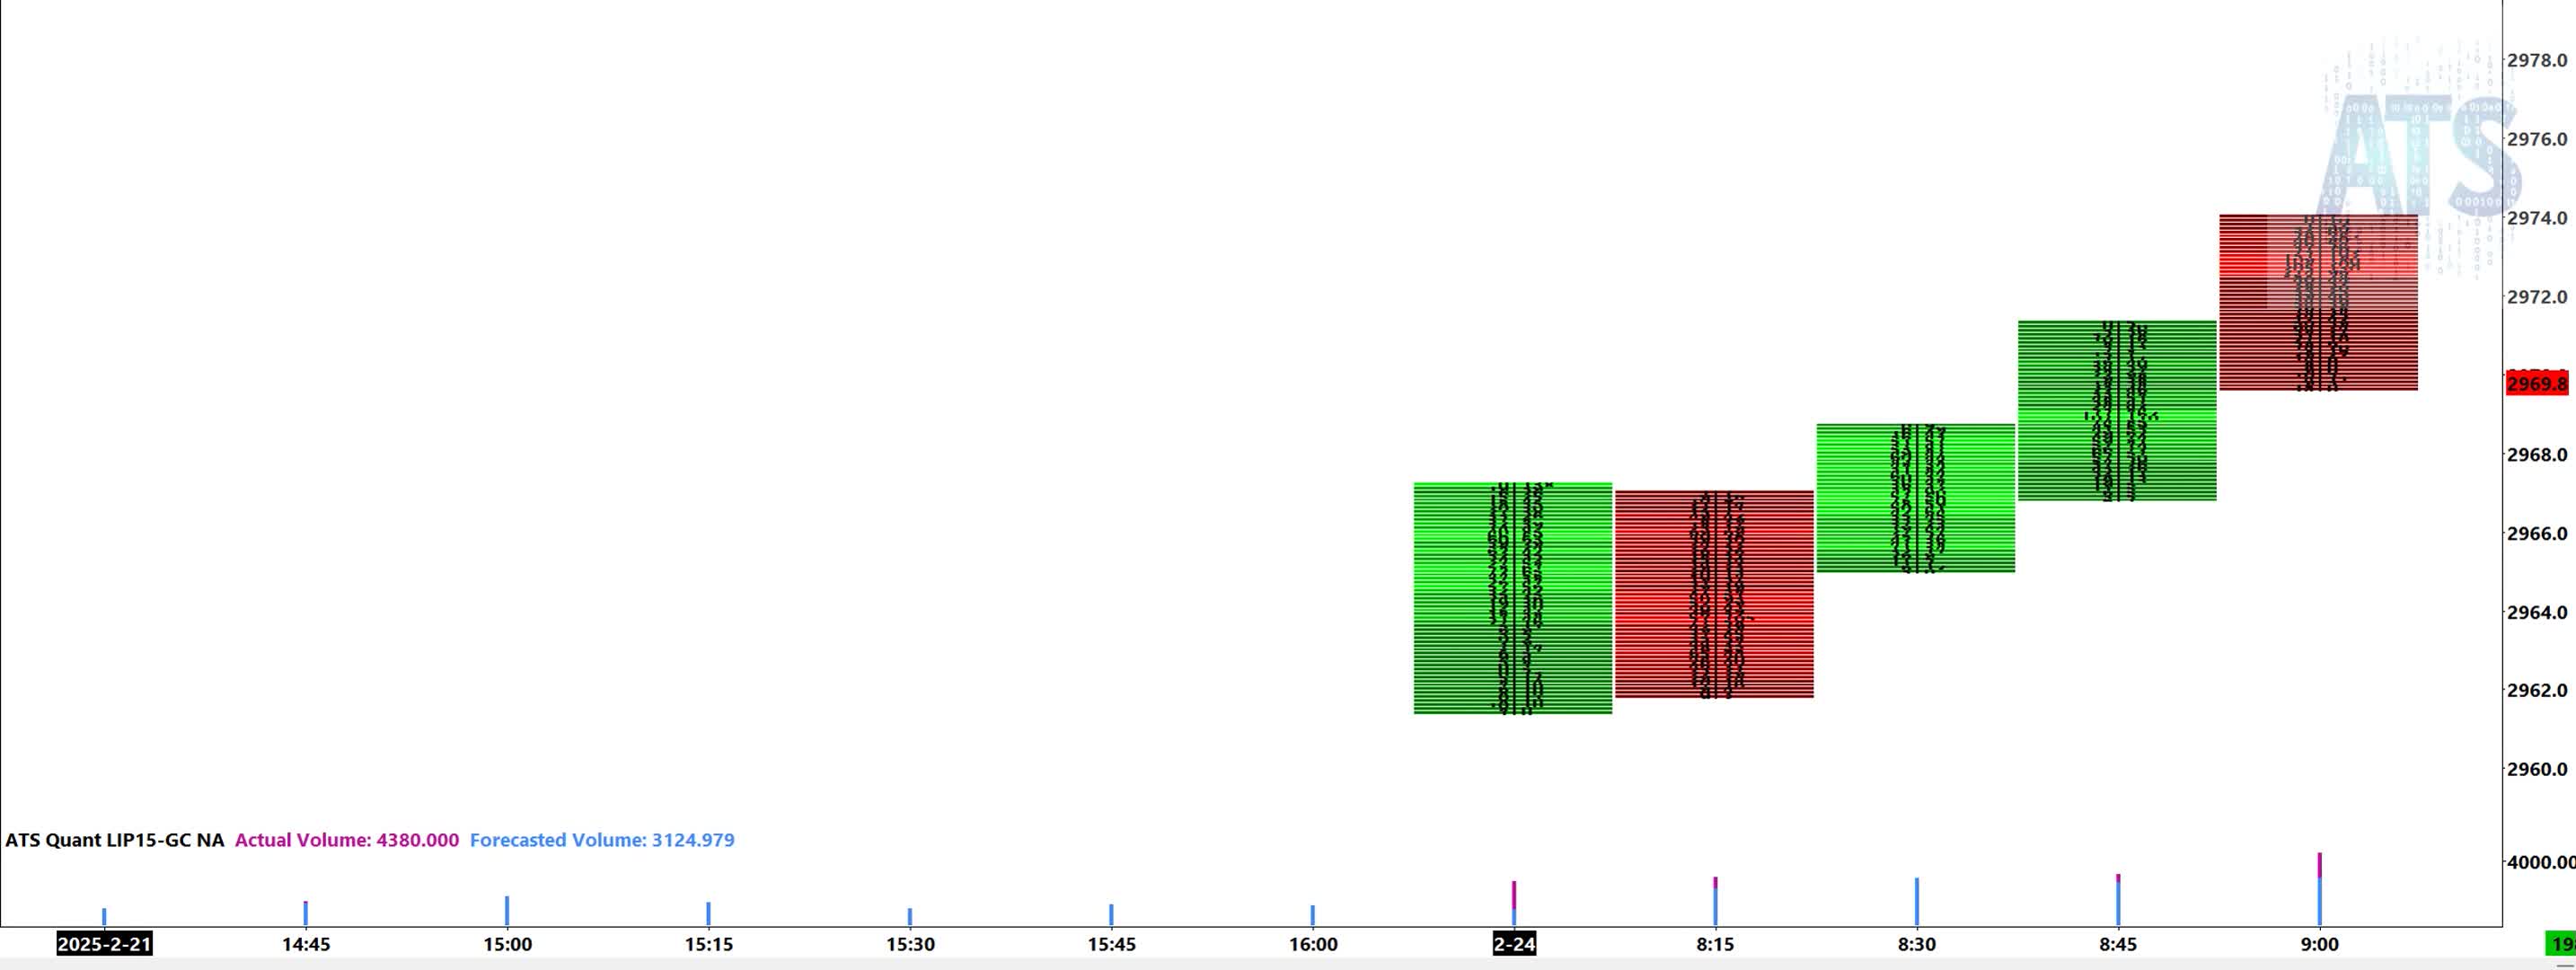
The model makes a forecast for the liquidity of the next bar at the close of the current bar.
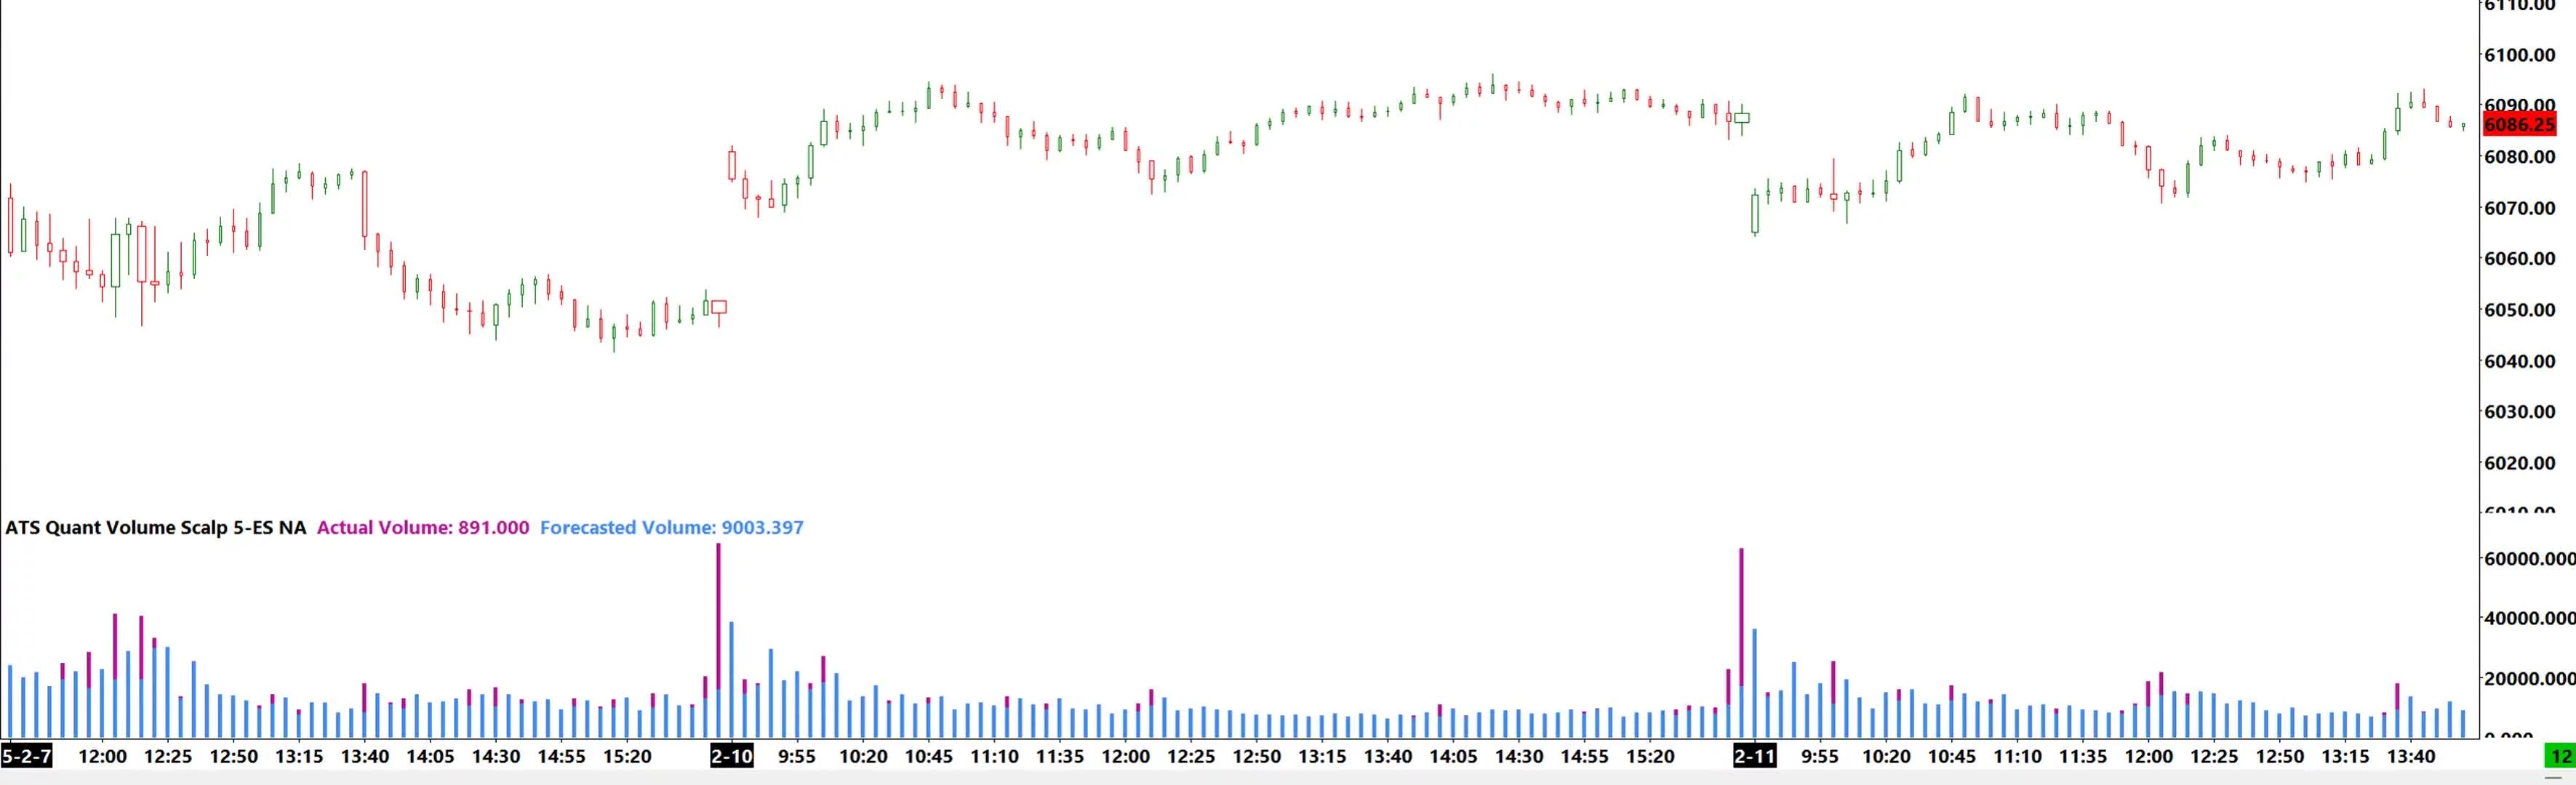
This is visible by looking at the model description area which shows, while the current bar is updating, the actual volume is changing but the forecasted volume is constant.
The actual vs forecasted bars’ color gradients allows the trader to see deviations from expected liquidity.
This information has several applications in risk management, trade management, strategy design.