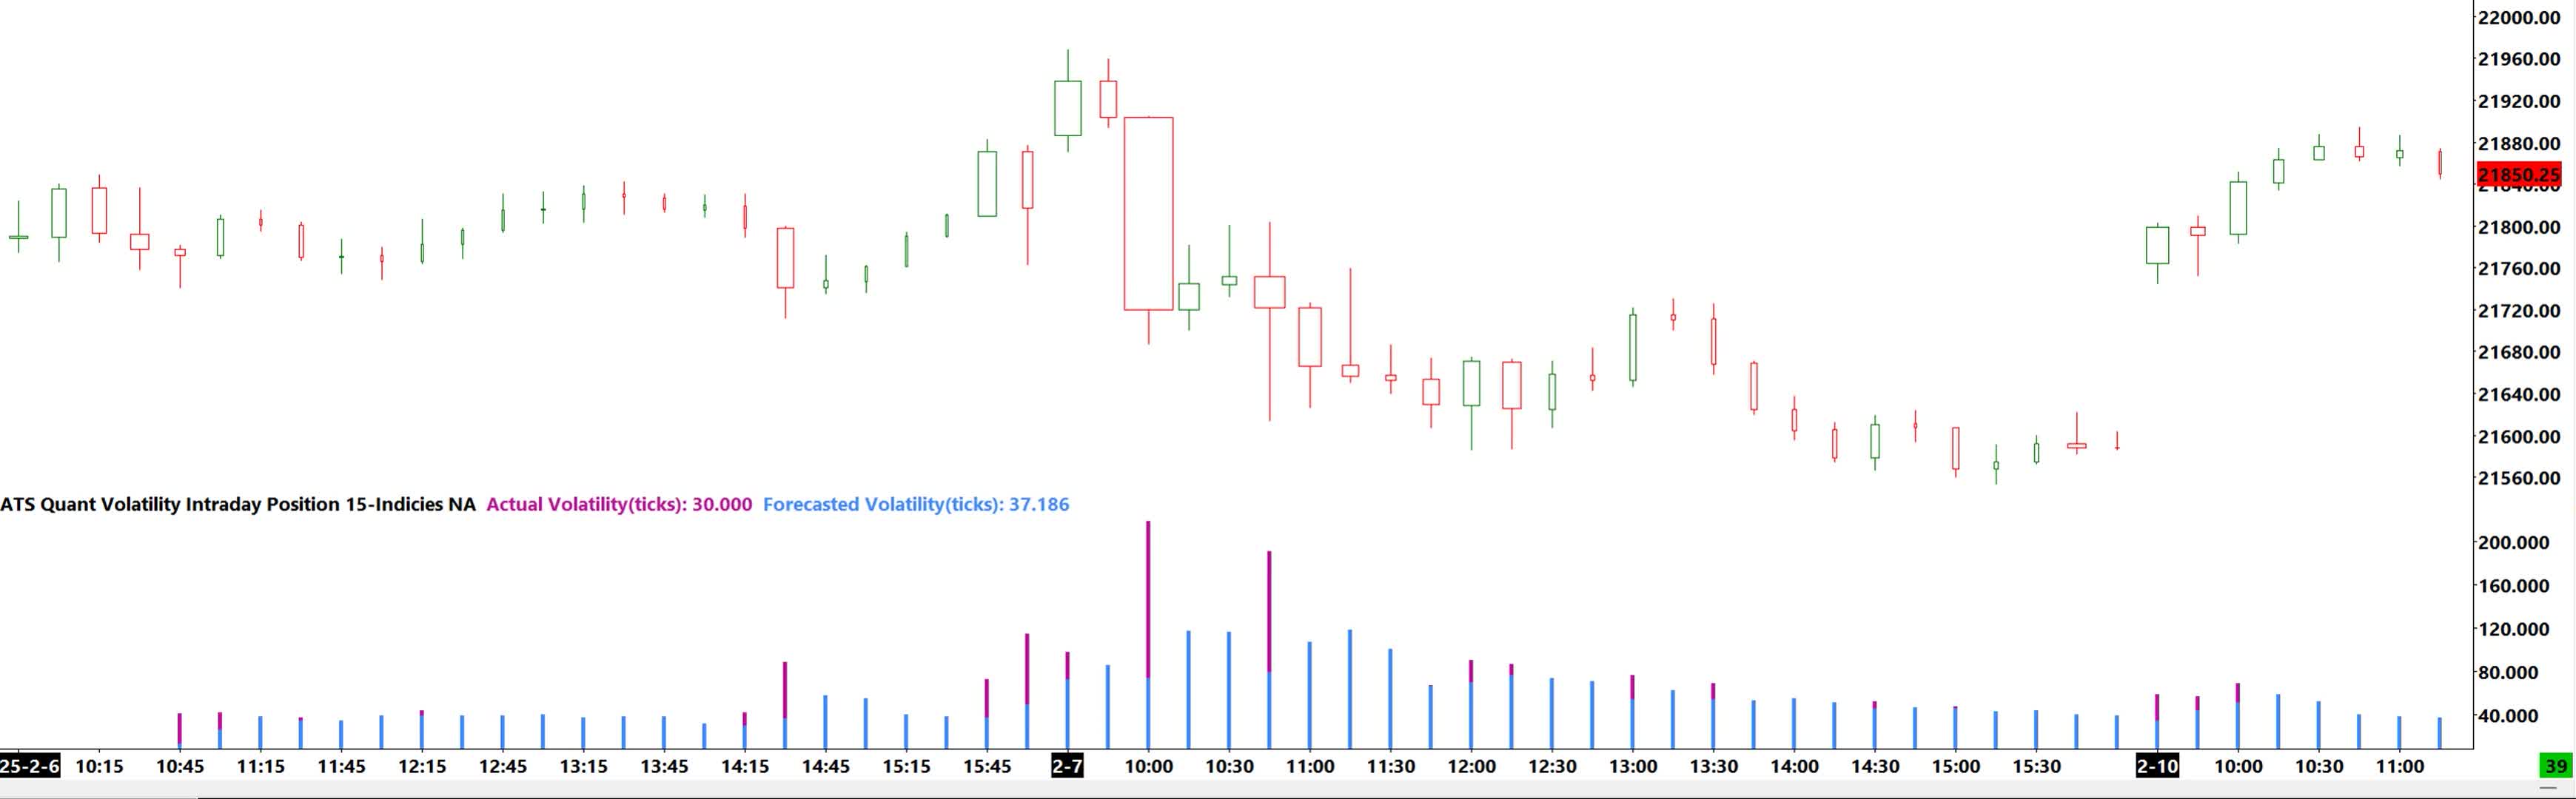
ATS Quant Volatility Intraday Position 15 (North American Session)
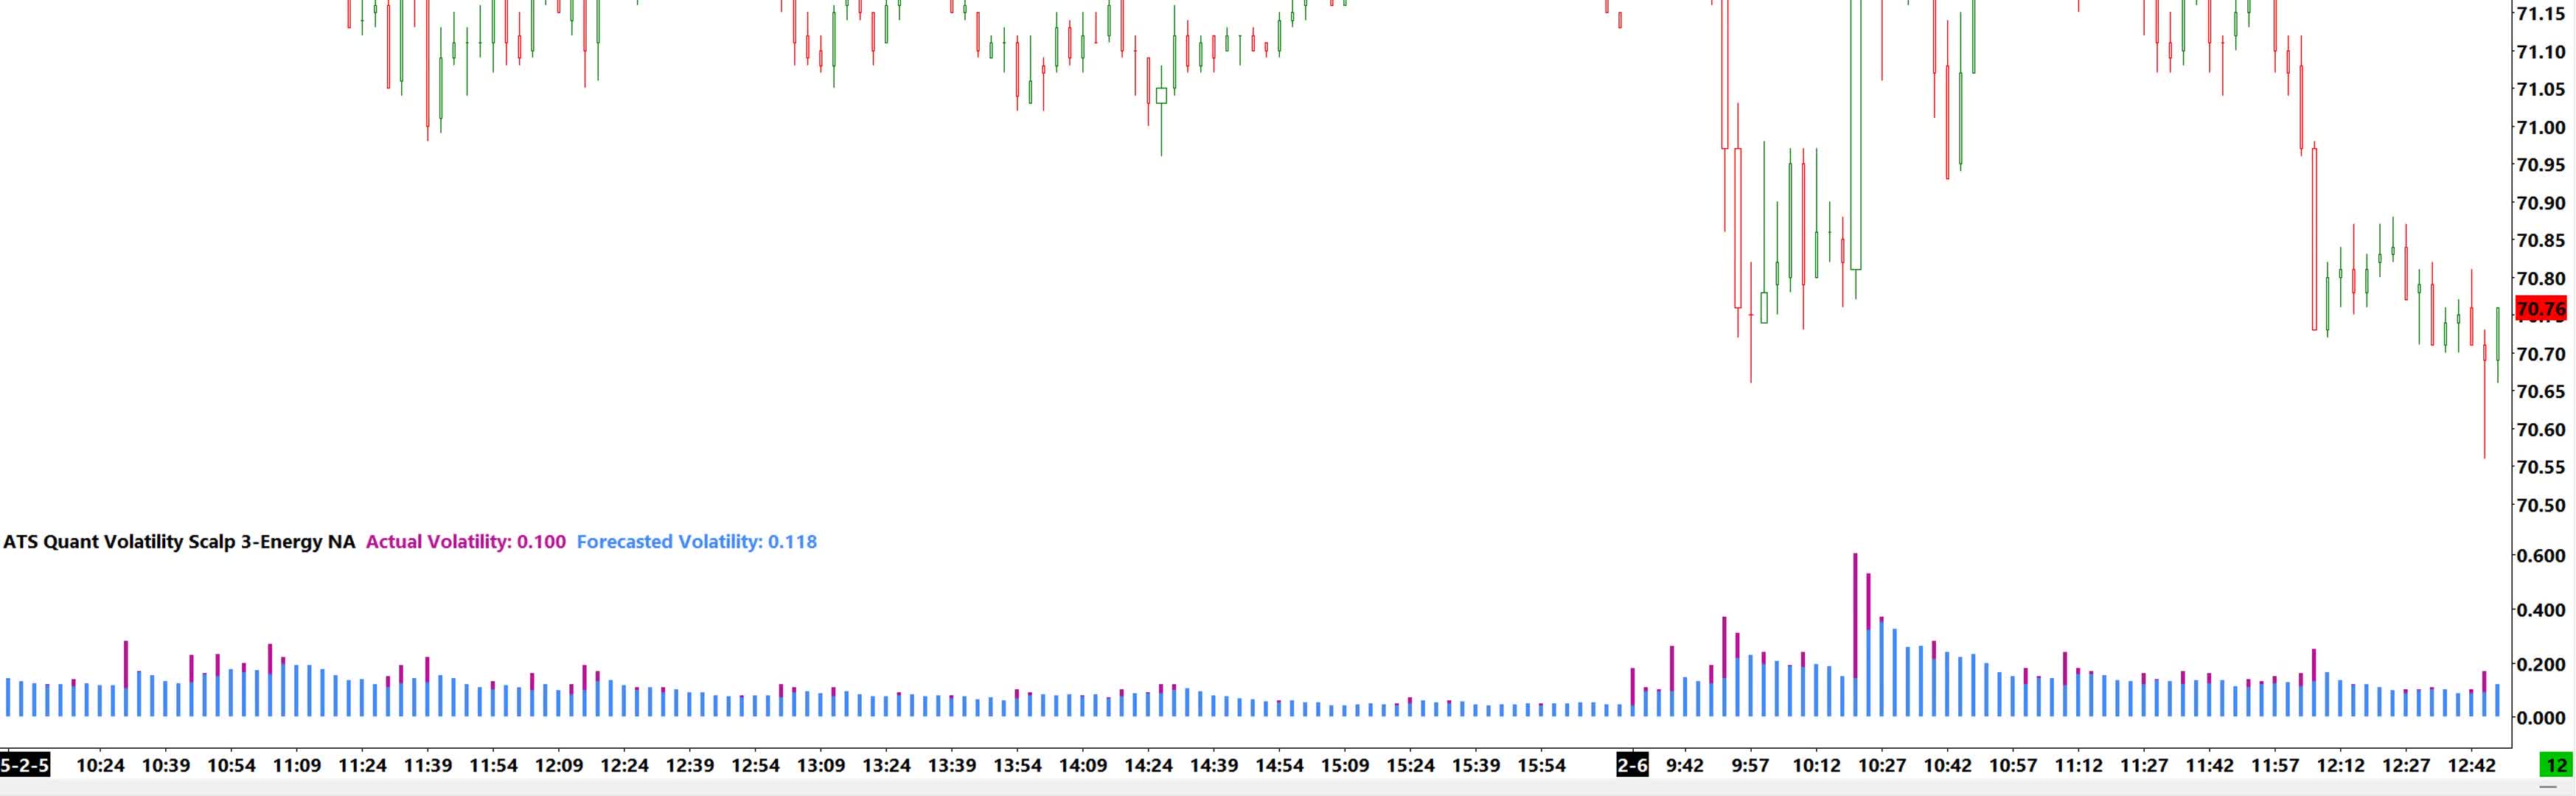
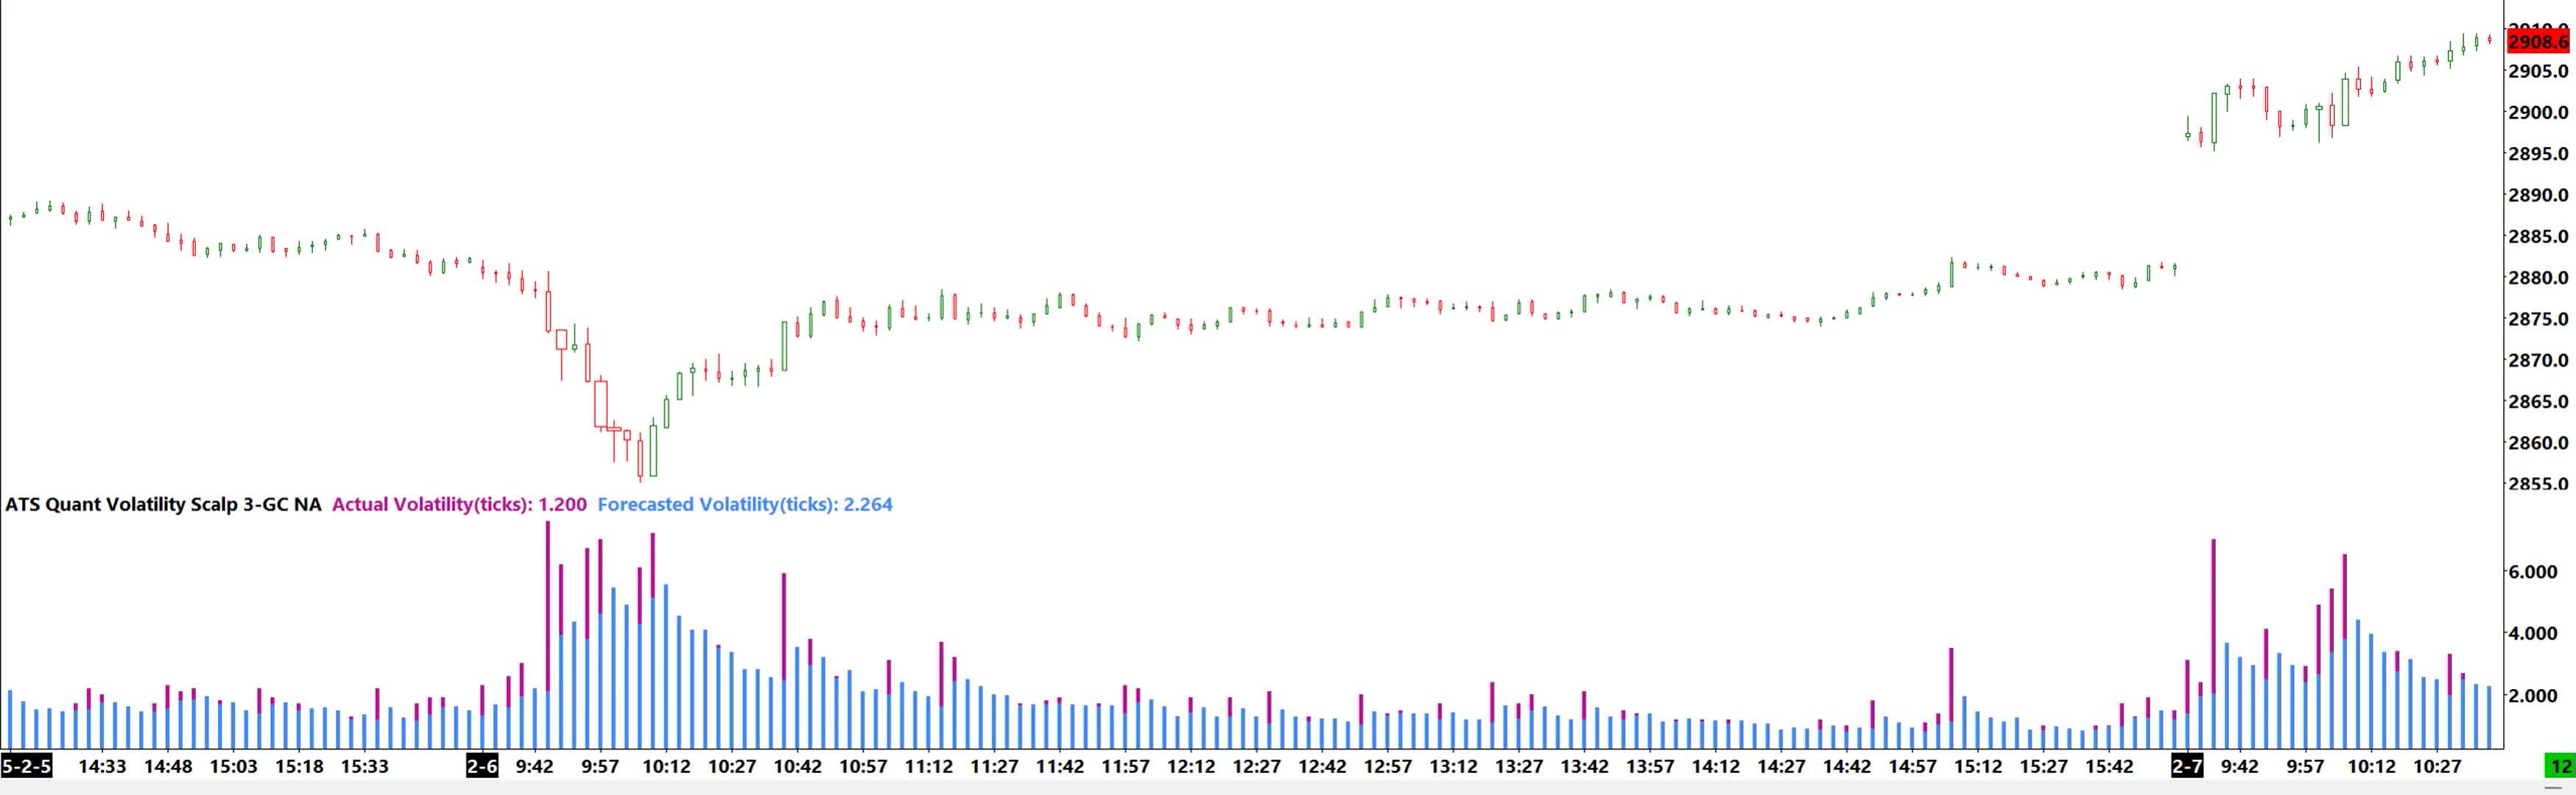
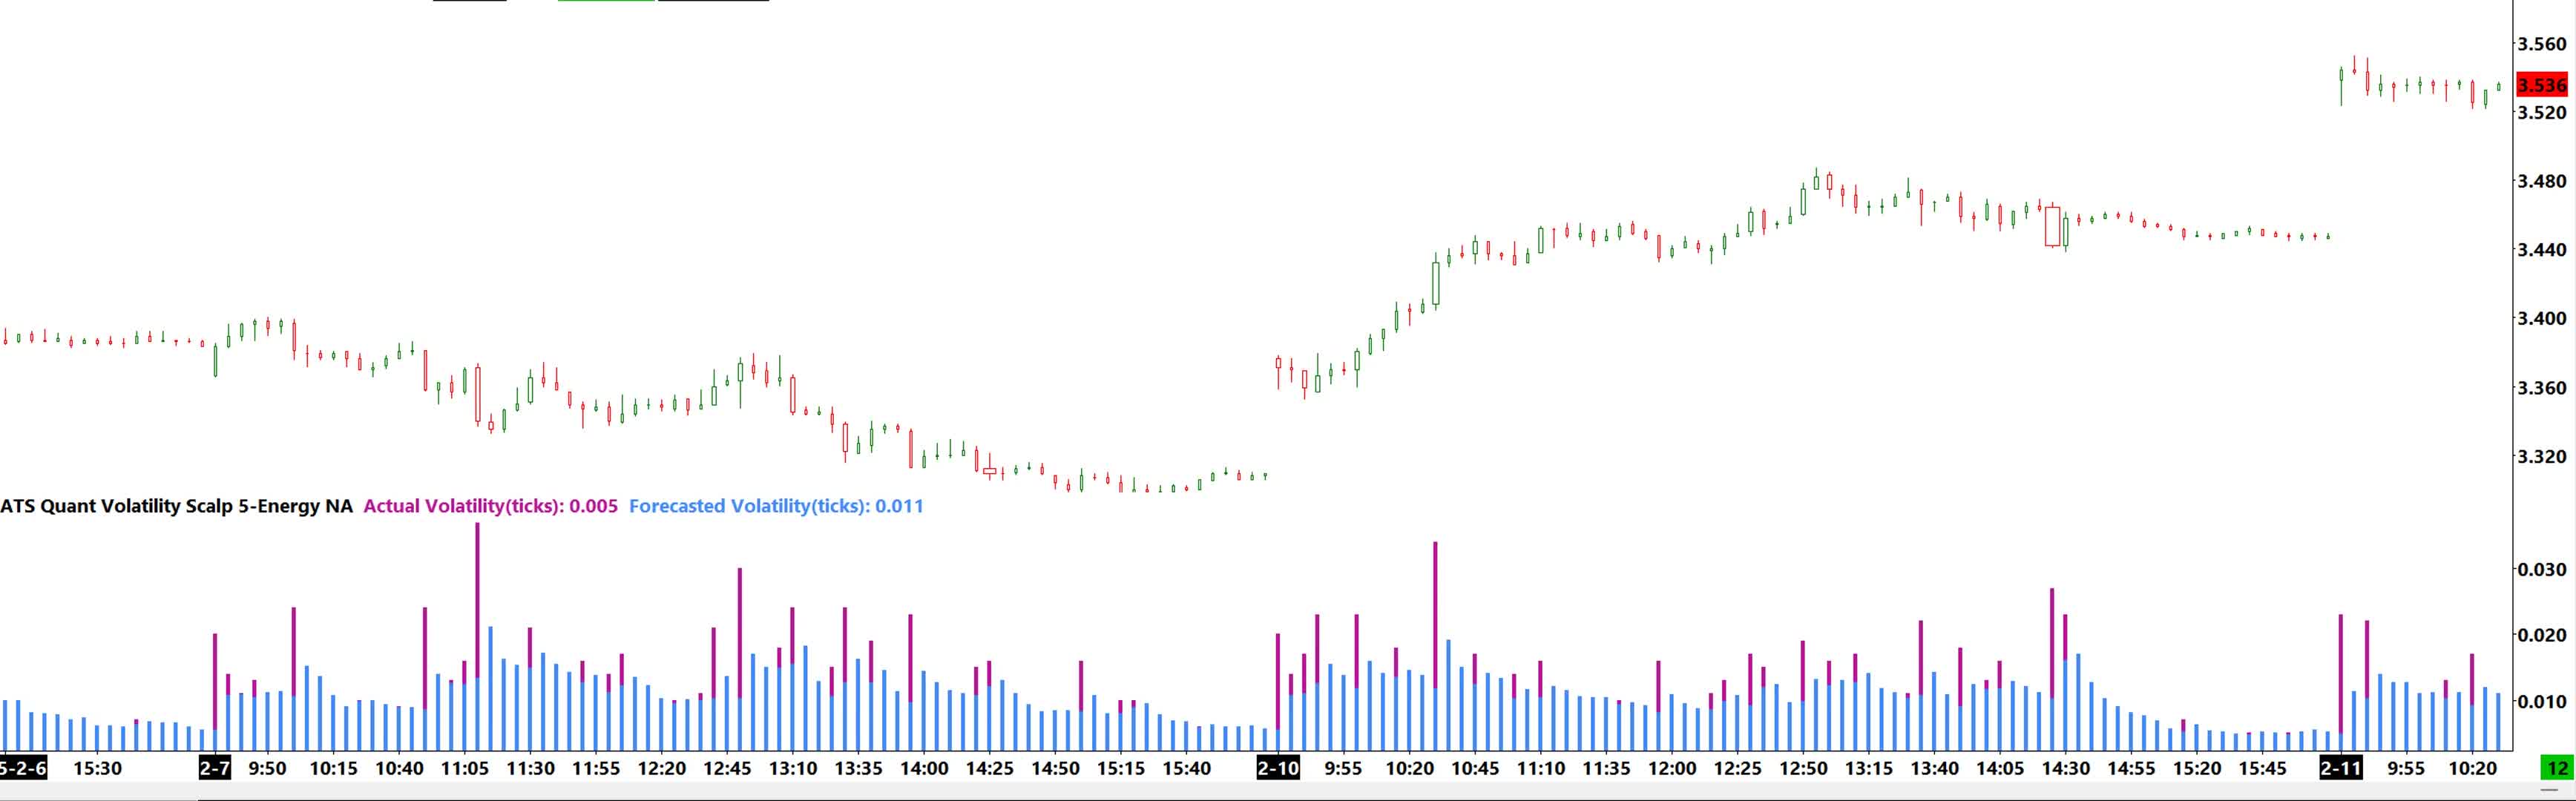
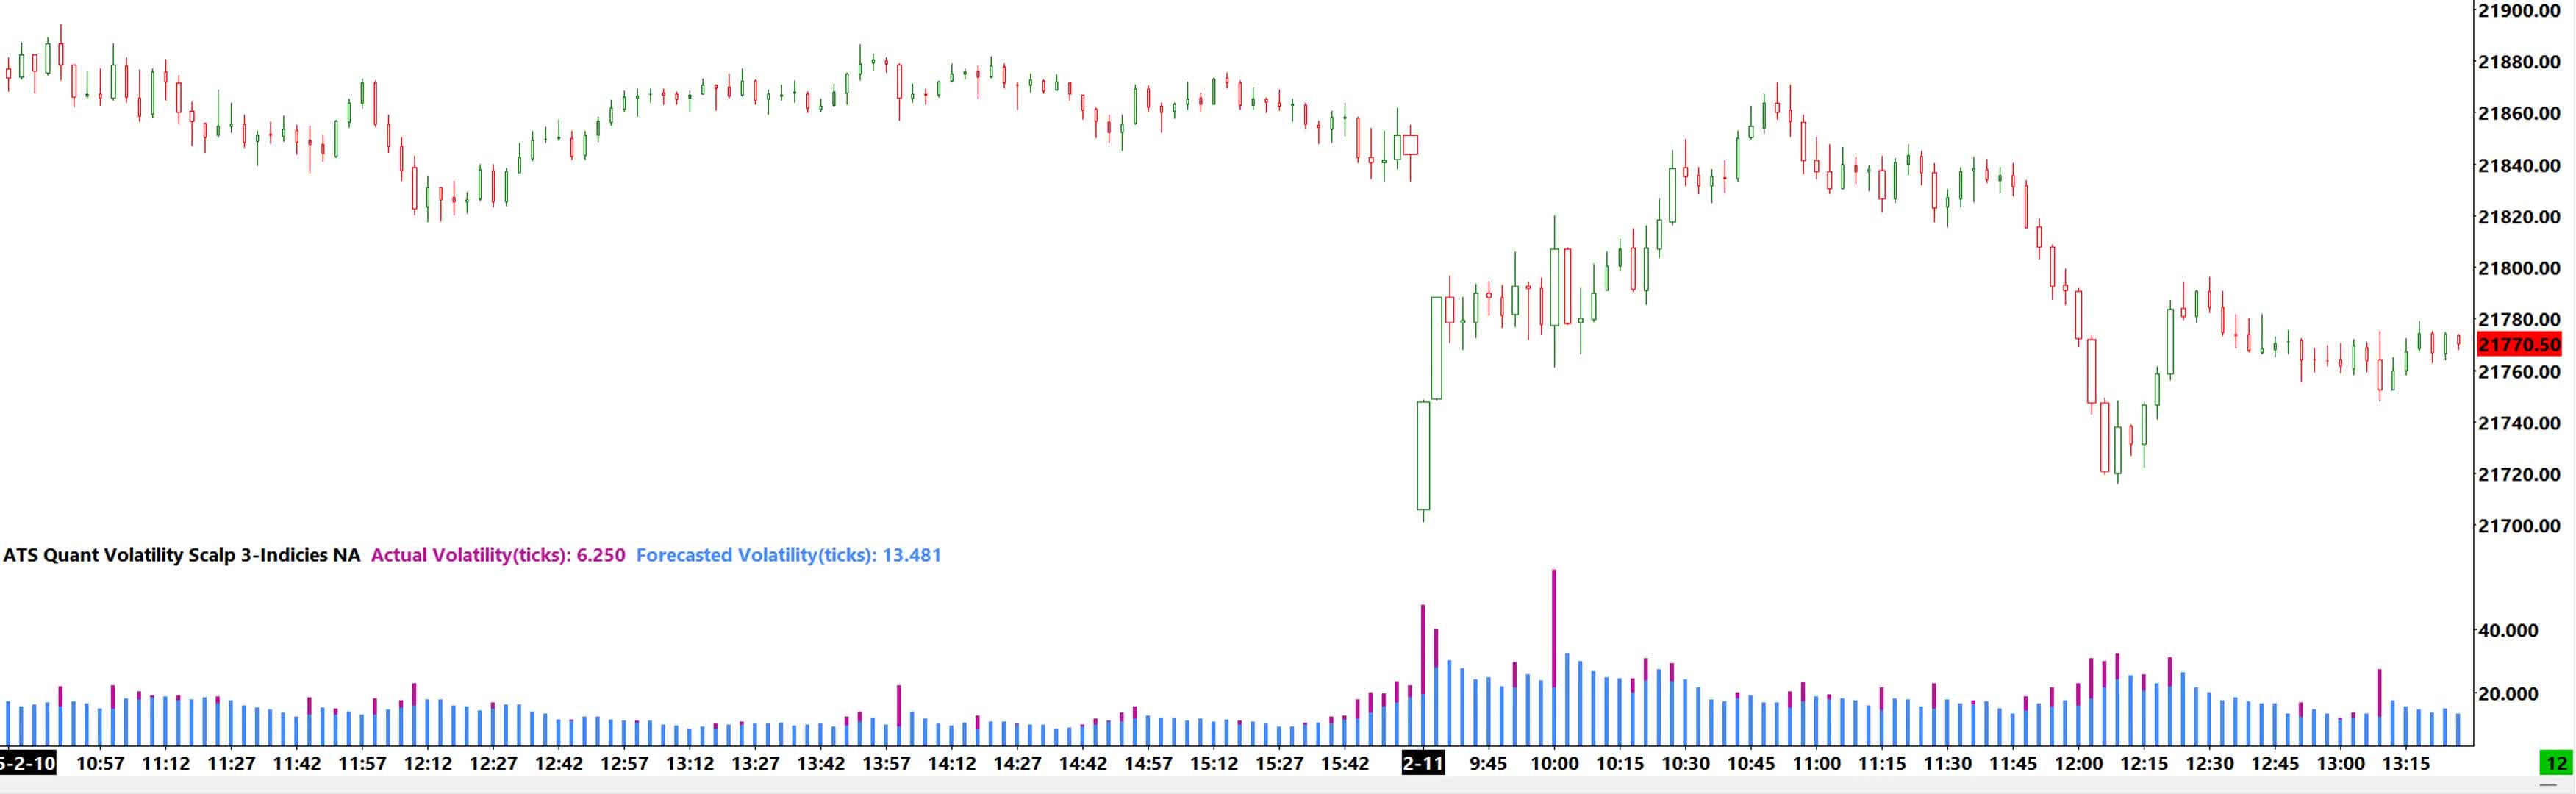
This model was trained over several years of market data with the aim of learning and forecasting the expected level of volatility for the next bar.
The model makes a forecast for the volatility of the next bar at the close of the current bar.
This is visible by looking at the model description area which shows, while the current bar is updating, the actual volatility is changing but the forecasted volatility is constant.
The actual vs forecasted bars’ color gradients allows the trader to see deviations from expected volatility.
This information has several applications in risk management, trade management, strategy design.
Previous